

Report Facebook ads dashboard is the most widely used report for marketing workers. Most of the businesses that are deploying dxx marketing on the Facebook channel are all using one LDA report According to his company's procedure. Of which, most prominently three types of reports serve three purpose groups, the need to read each company's statistics. The following is the top 3 DM report ads dashboard popularly combined by OpenDB:
Facebook Ads Basic Report Dashboard
Dashboard this is the ideal starting point for any marketing room that wants to take a quick look, generalizing on Facebook Ads performance without going into complex details. It provides the most basic picture of spending and results, suitable for fast meetings or daily tracking.
Purpose of Use
- Monitor general spending and Facebook Ads results.
- Evaluating joint performance of account or major campaigns.
- Use as a daily/JK report for teams and middle-level management.
- Help new people get used to tracking advertising data.
Highlights Indexes
- Amount Spent total cost: The total amount of money spent during the report time.
- Total display of Impressions: The total number of your ads is shown.
- Total Reach Approach: Total number of people have seen your ad.
- Number of clicks Link Clicks: The number of times users click on links in the ad.
- CRT ClickThrough Rate: The percentage of clicks per total turn display, indicating the appeal level of advertising.
- CPC Cost Per Click: Average cost for each turn clicking on the link.
- Total Convert Total Conversions: The total number of moves achieved the example: purchases, registrations.
- CPA Cost Per Action/Conversion: The average cost for each move.
- ROAS Return On Ad Spend: The profit rate is on advertising costs if there is a conversion value data.
Demo facebook basic report dashboard
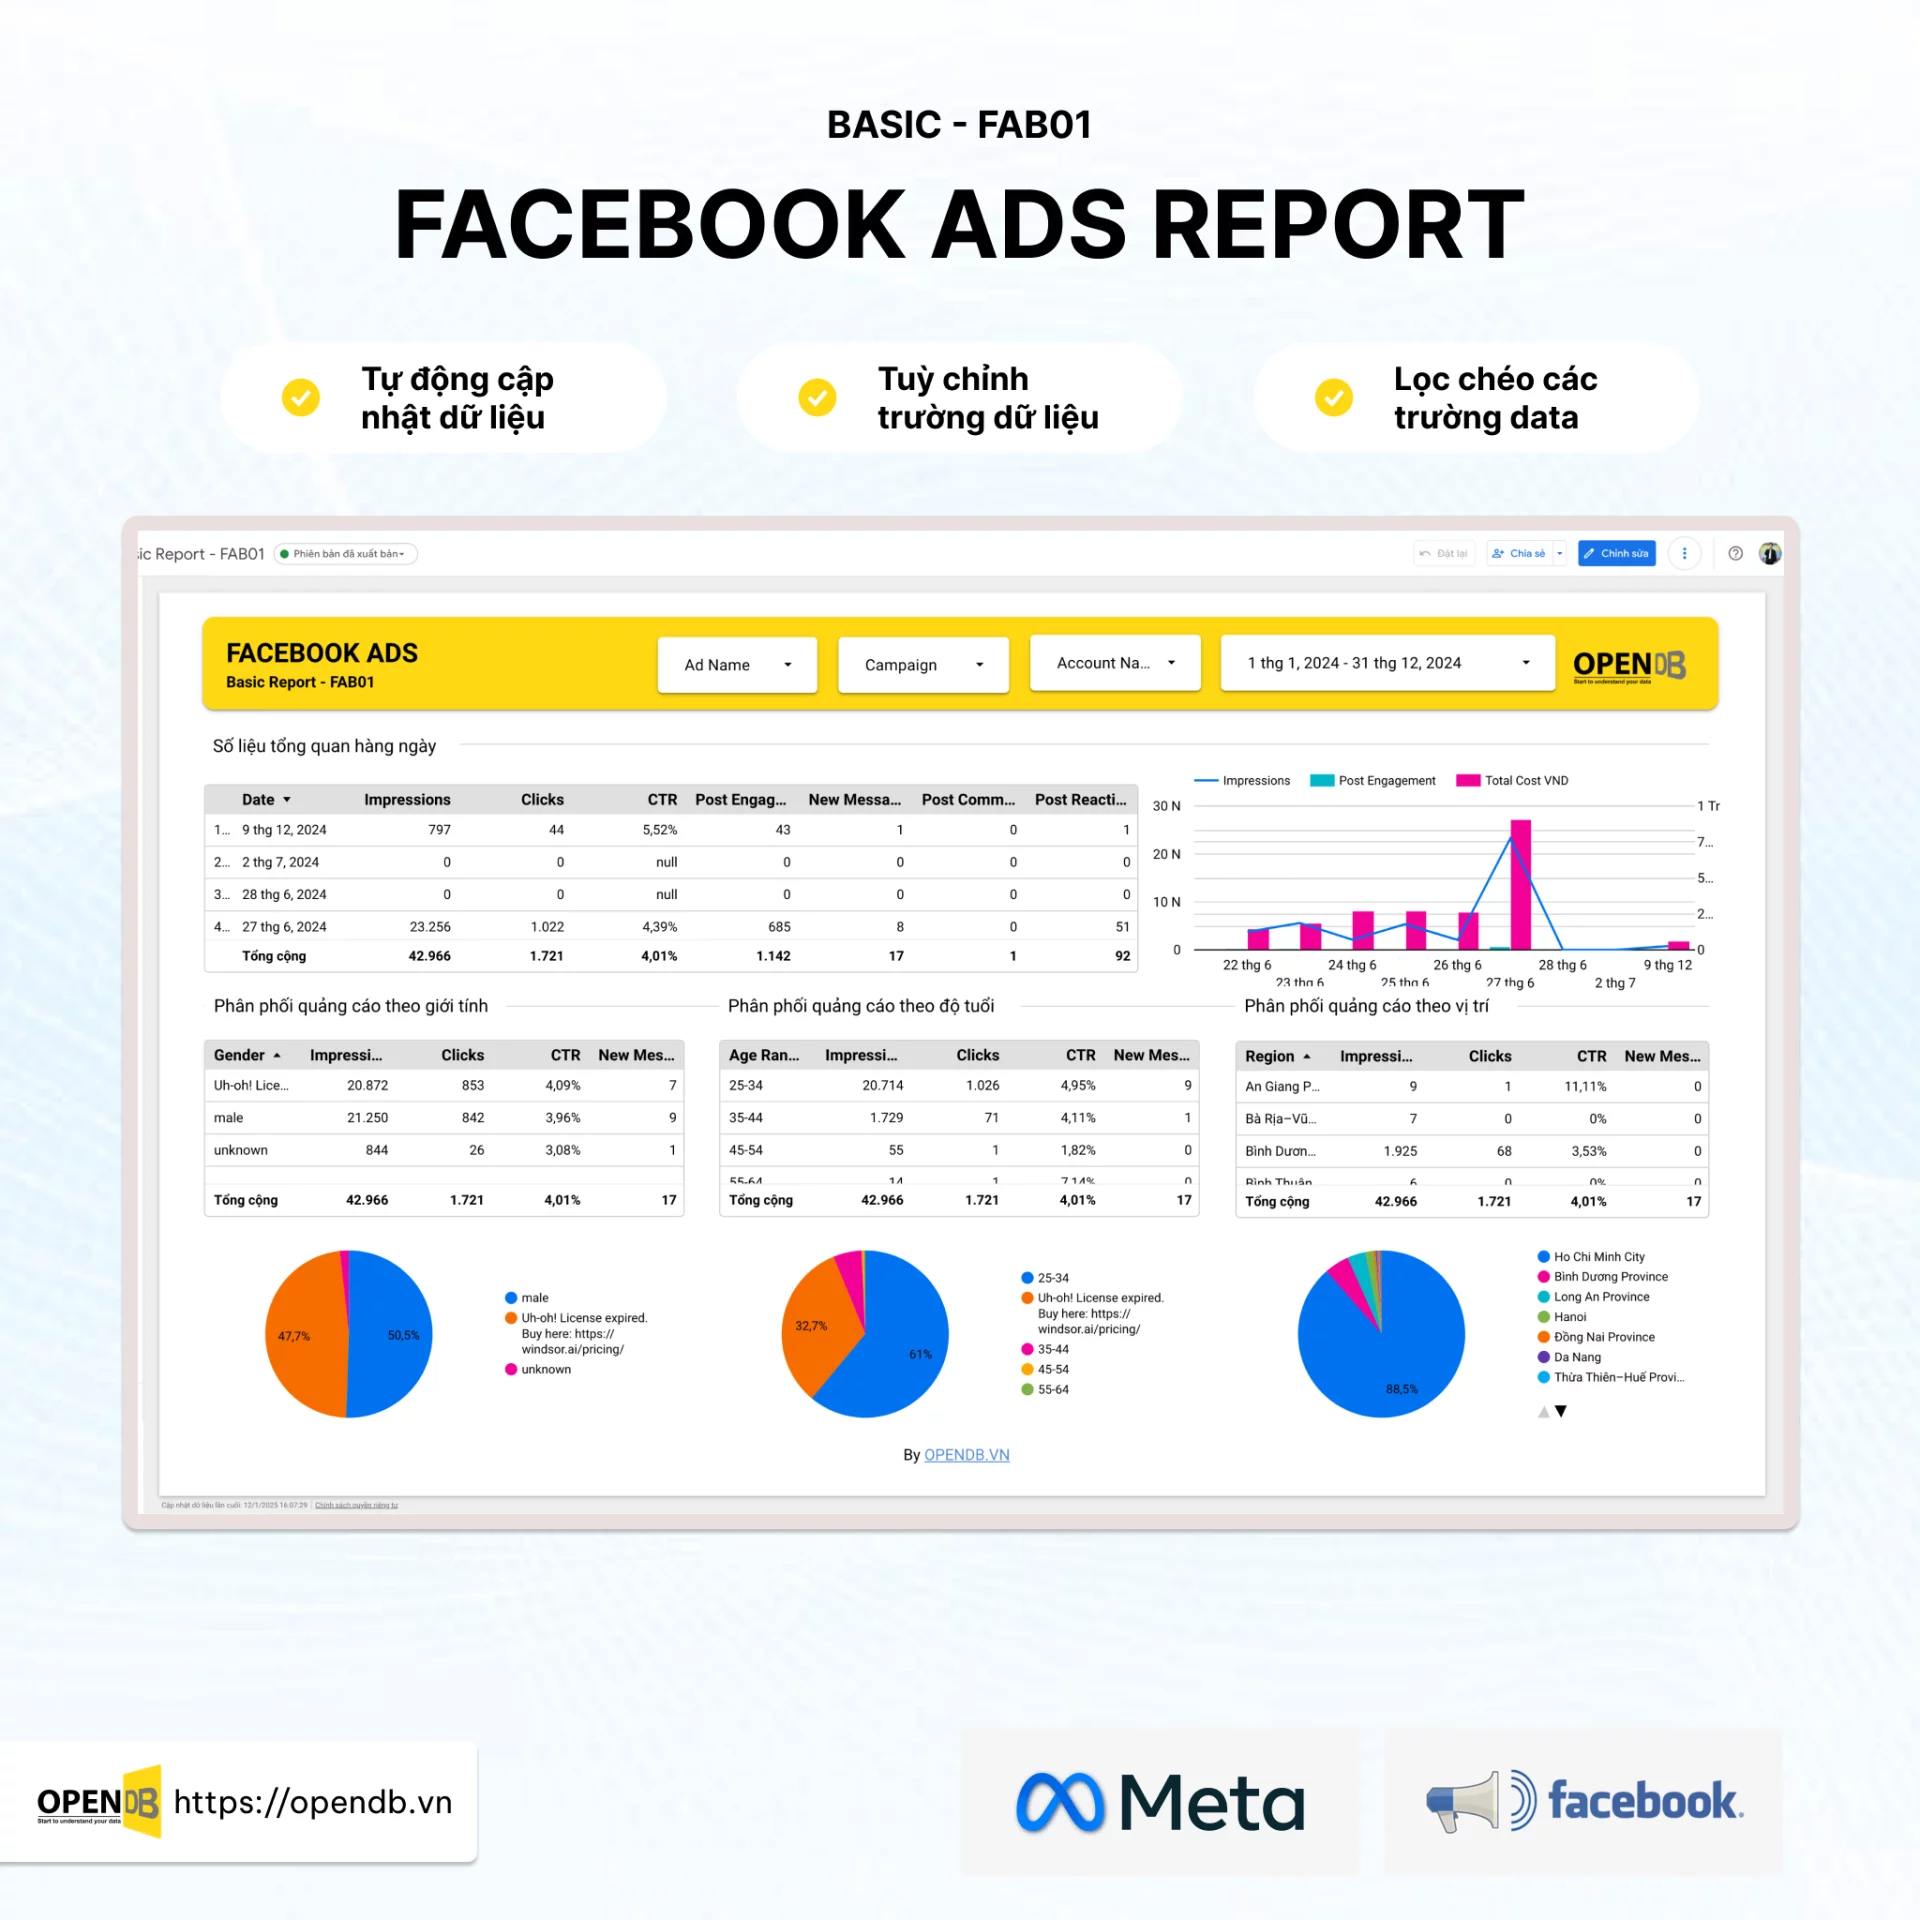
Facebook Ads Basic Report Dashboard displays charts on cost trends over time, synthetic tables, and general indicators are highlighted to be easy to capture the situation. Demo will help you visualize how the indicators are intuitive and how the dashboard is held logically.
Facebook Performance Report Dashboard
This Dashboard was designed to provide a deeper view of advertising performance, not only stopping at basic indicators but also entering more detailed analysis of campaign efficiency, advertising groups and objects. It helped marker optimize the campaign to achieve specific goals, focusing on profits and investment efficiency.
Purpose of Use
- A detailed analysis of performances of individual campaigns, advertising groups and advertising.
- Text Advertising Performance Report
- Advertising Advertising Report
- Báo cáo đánh giá hiệu quả quảng cáo chuyển đổi mua hàng trên website / landingpage
- Đánh giá hiệu quả ROAS/CPA và tối ưu hóa ngân sách quảng cáo.
- So sánh hiệu suất giữa các giai đoạn thời gian hoặc các chiến dịch khác nhau.
- Tìm ra các chiến dịch/quảng cáo hoạt động tốt hoặc kém hiệu quả để đưa ra quyết định kịp thời.
- Phục vụ cho các buổi họp phân tích sâu hơn với đội ngũ marketing.
Highlights Indexes
- Chi phí theo chiến dịch/nhóm quảng cáo/quảng cáo: Phân bổ chi tiêu theo từng cấp độ.
- Hiệu quả quảng cáo tin nhắn: Số lượng Chi phí tin nhắn Tỉ lệ nhắn tin..
- Hiệu quả quảng cáo chuyển đổi mua hàng trên website / landingpage: Số lượt chuyển đổi Chi phí chuyển đổi ROAS Giá trị đơn hàng
- ROAS Return On Ad Spend: Chỉ số quan trọng nhất cho chiến dịch ecommerce, cho biết doanh thu tạo ra từ mỗi đồng chi phí quảng cáo.
- CPA Cost Per Action/Conversion: Chi phí cho mỗi hành động mong muốn, giúp đánh giá hiệu quả chuyển đổi.
- Tỷ lệ chuyển đổi Conversion Rate: Tỷ lệ người xem quảng cáo thực hiện hành động chuyển đổi.
- Tần suất Frequency: Số lần trung bình một người thấy quảng cáo của bạn, giúp đánh giá mức độ bão hòa.
- Điểm phù hợp Relevance Score nếu còn áp dụng: Đánh giá mức độ phù hợp của quảng cáo với đối tượng mục tiêu.
- Phân tích theo nhân khẩu học/địa lý: Chi phí, ROAS, CPA được phân tích theo độ tuổi, giới tính, vị trí địa lý.
- Phân tích theo thiết bị: Hiệu suất quảng cáo trên di động so với máy tính để bàn.
Demo Facebook Performance Report dashboard
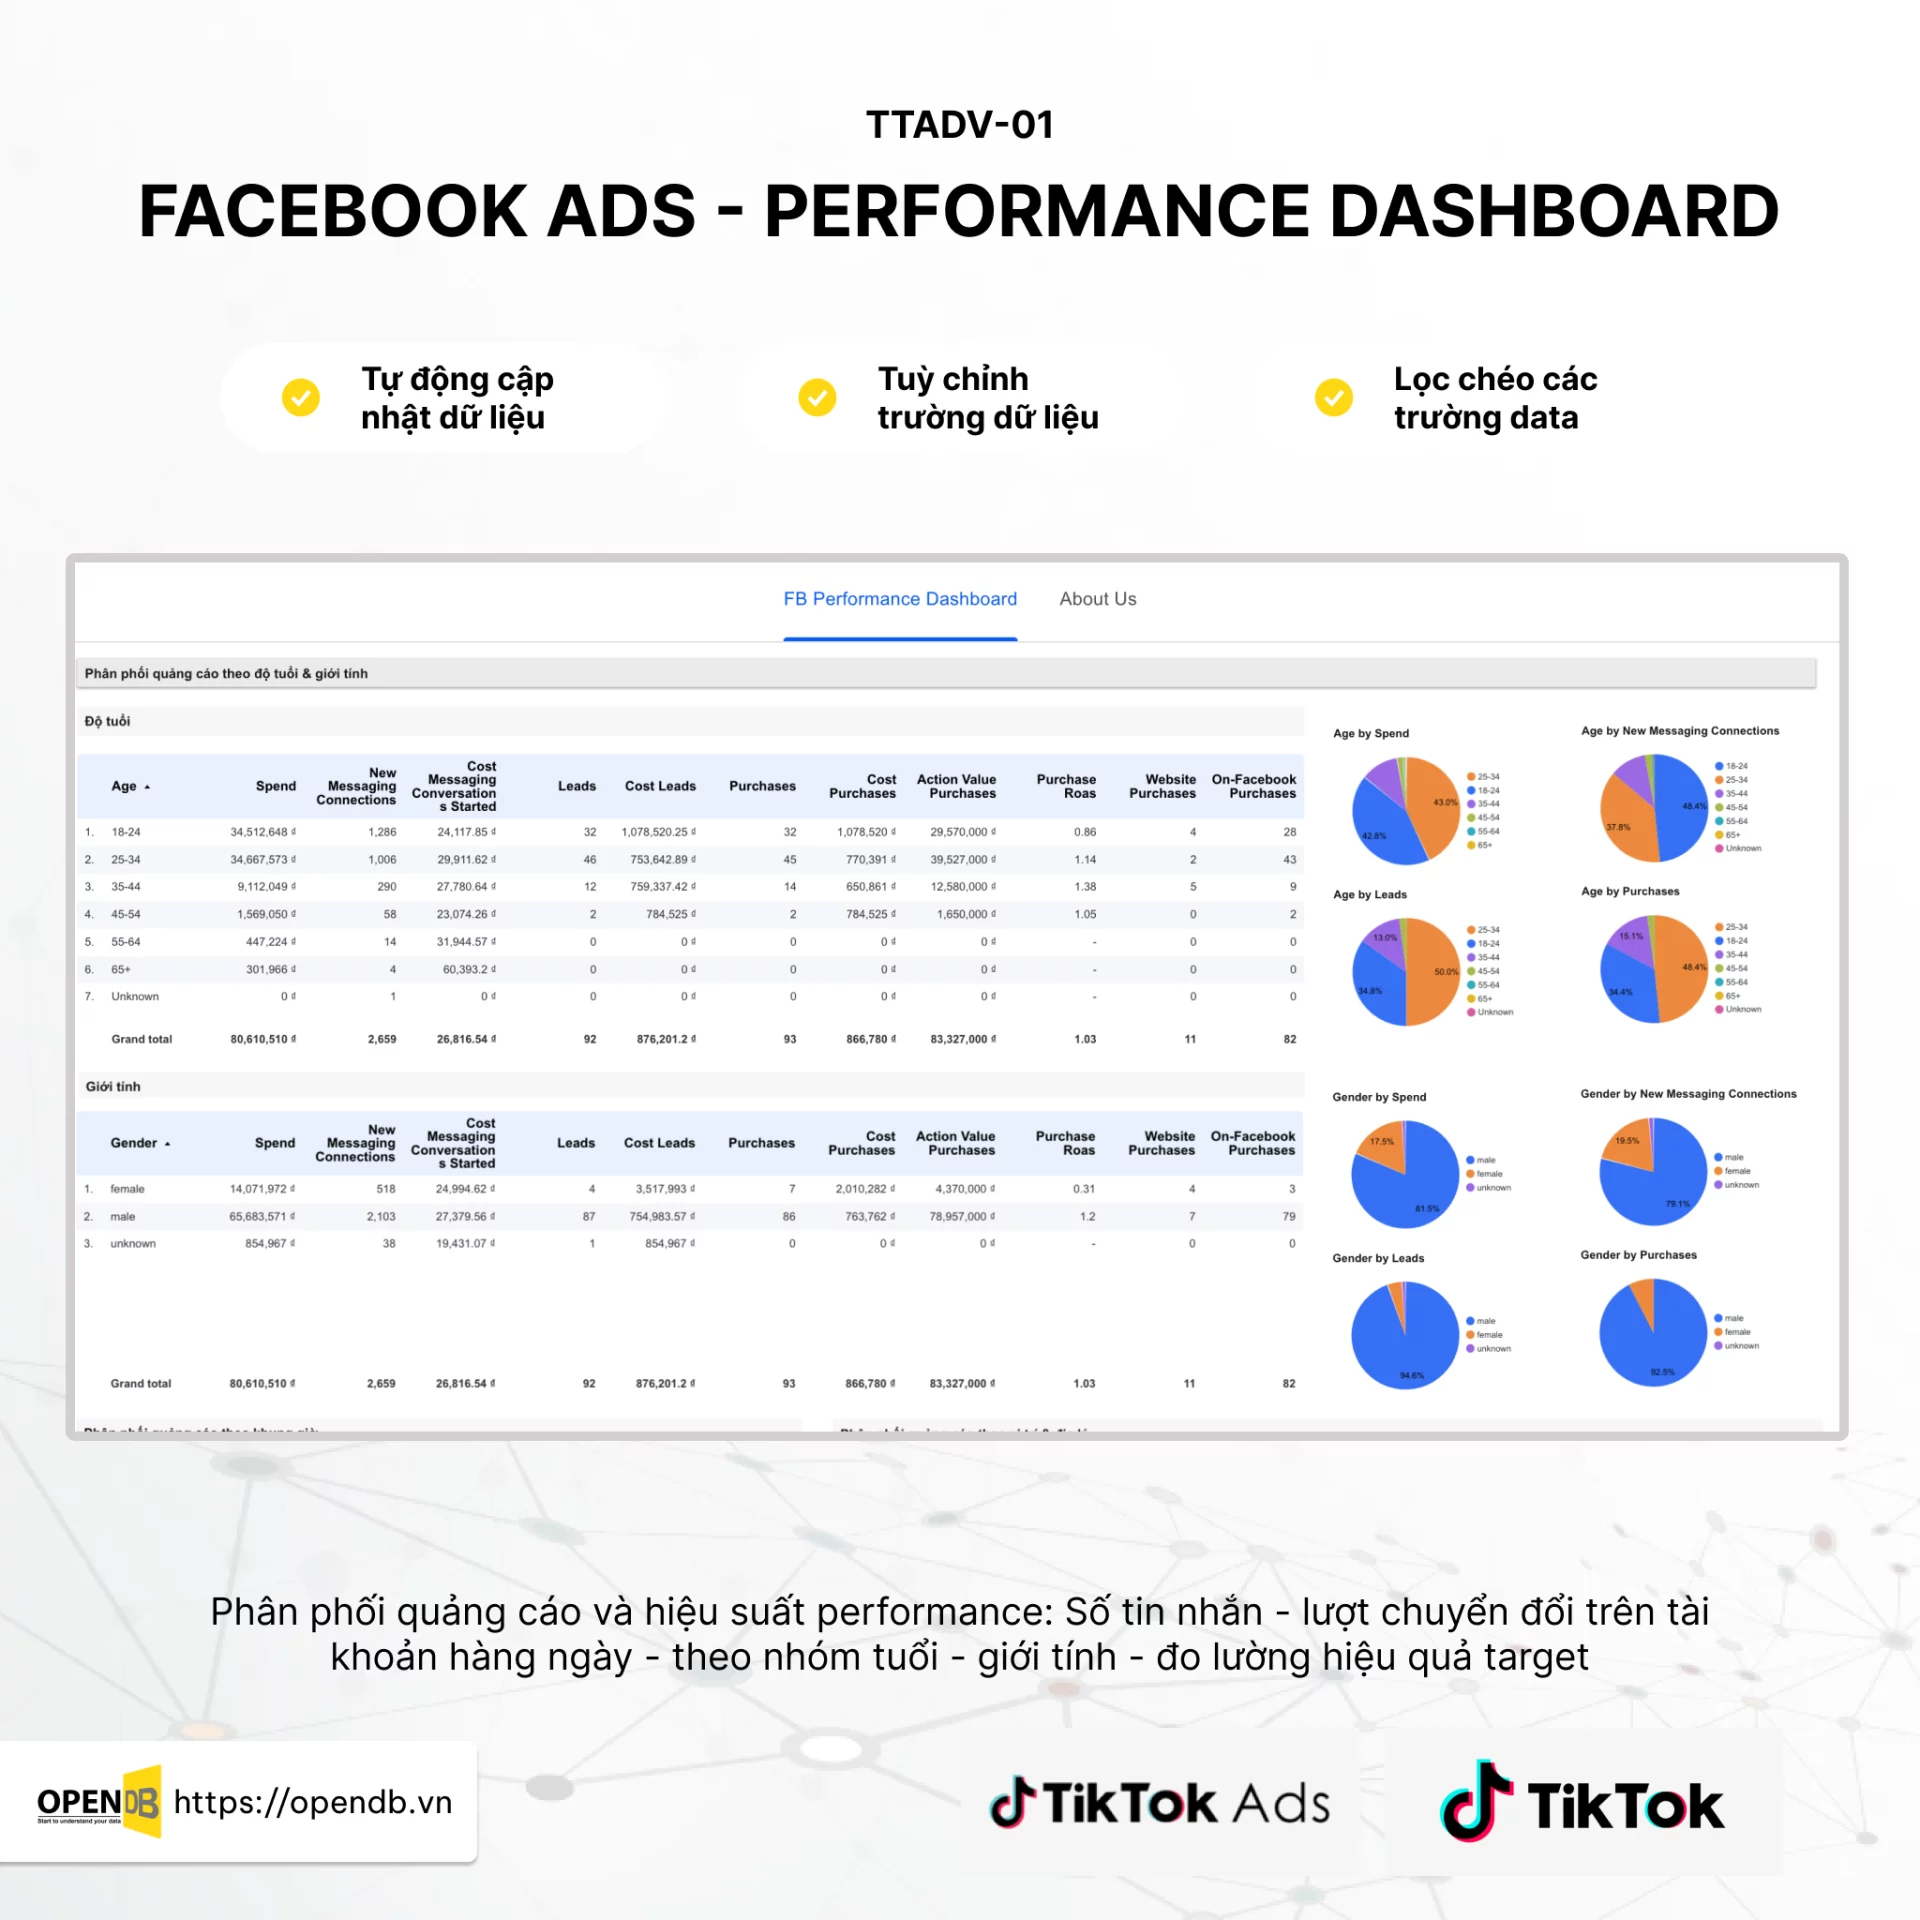
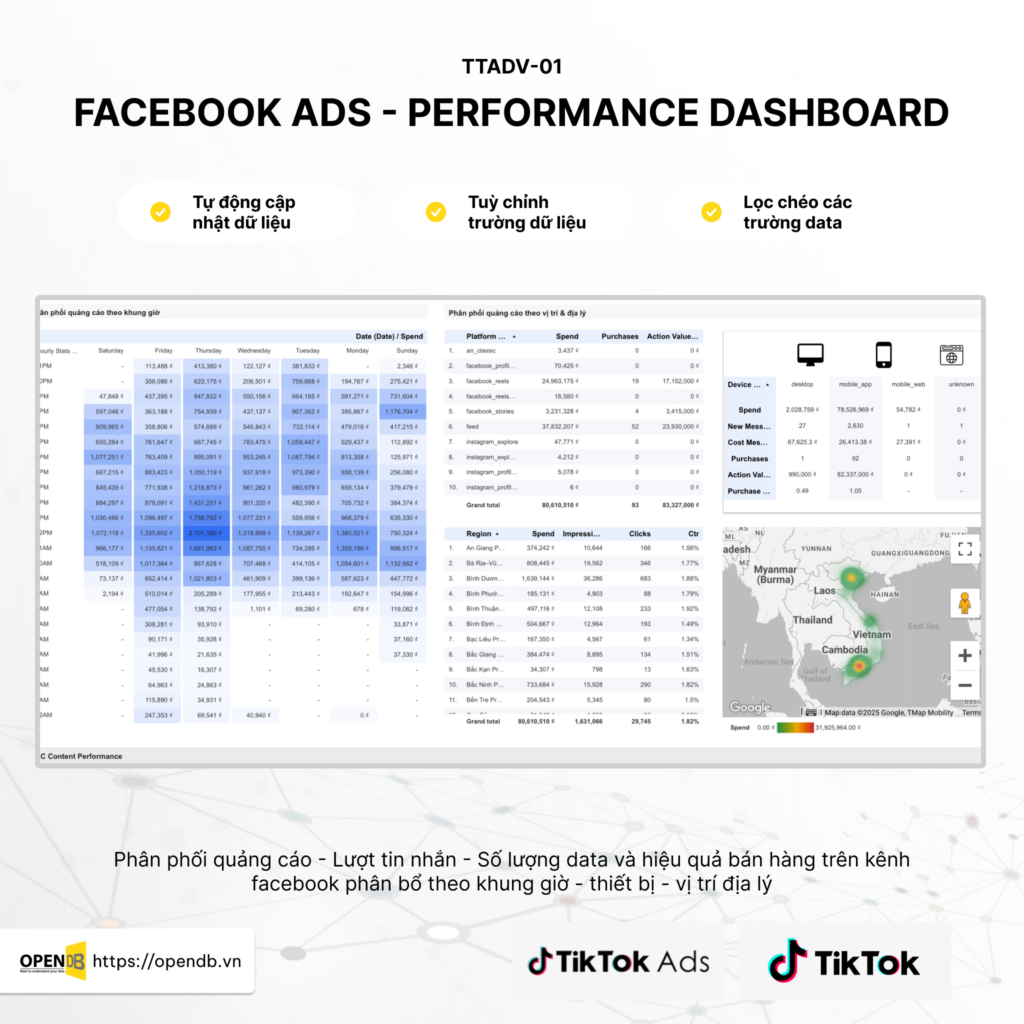
Demo Facebook Performance Report shows the ROAS trend charts, CPA, or the rate of conversion over time, the performance detailed analysis boards of each campaign, the advertising and advertising groups. You can also see effective analysis charts according to demographics or equipment objects, which help you to determine better who is interacting with your ads.
Facebook Apprecord Report Dashboard
Dashboard Facebook Appresnel Report Specially for Application Developers or businesses that want to track and optimize effective promotional campaigns install applications on Facebook. It focuses on the indicators associated with the installation turn and the user quality after installation.
Purpose of Use
- Track numbers and costs each turn installing applications from Facebook Ads.
- Evaluate user quality following installations for example: activate, purchase in applications.
- Compare performances between different application installation campaigns.
- Exclusive budgets to reduce CPI Cost Perprentationll and increase quality installation numbers.
Highlights Indexes
- Total installment of AppRecords Applications: The total number of recorded application installations.
- CPI Cost Perresnel: The median cost per session installs the application.
- The cost in turn of the specific installation: The CPI analysis follows the campaign, the advertising group.
- New Apprequencylls: The number of users installed for the first time.
- Event in the InAppNotes Application: The number of times users perform important actions in examples applications: enrollment, completion of instructions, purchases.
- Cost for each event in the application: Effective evaluation costs to achieve actions in application.
Demo Facebook Apprealll Report dateboard

Demo Facebook Appresnel Report ashboard will show the turn-off charts for installing applications and CPI over time, the installation performance boards between various campaigns and advertising groups. In particular, it will highlight the events in applications and costs for each event, which will enable you to evaluate not only the amount but also the quality of users attracted by advertising.

