

In dynamic digital marketing environment, work Facebook Advertising effectively playing a key role in optimizing the budget and promoting revenue growth. However, the process of managing and analyzing massive amounts of data from Facebook Ads Manager often sets significant challenges for marketers. Information fragmentation, manual report processes that waste time, and lack of overall overall capacity in time are major barriers. So building one Facebook Report System Automatic Ads Looker Studiothrough combining metric indexes and the original dimensions effectively, has become an optimum solution to creating high-value charts and data charts.
1. Data problem fragmented and reported unfocused
Although Facebook Ads Manager is a powerful tool, work Facebook Advertising Directly on this platform often manifests certain restrictions. Data tends to scatter between different levels such as accounts, campaigns, advertising groups and advertising, requiring the marketers to constantly change the interface to synthesize information. Furthermore, the release of manual and composite reports on the tablet applications not only takes much time but also hides high risk of error, especially for the regular reporting cycles. These factors hinder the ability to get a comprehensive view, compare effectively between the campaigns, and make optimum decisions on time.

Advertising manager has extremely much data, but is difficult to view overall
2. Looker Studio: The Solution to Drag Automated Data and dashboard Composite
Looker Studio previously Google Data Studio emerged as an effective solution to the above problems. This free platform allows automaticization of the process Retrieve Facebook Ads data via data connoctors data connections. After establishing a connection, Looker Studio will automatically update the data, from which to allow users to build the dashboard Mixed, intuitive and updated in real time. This greatly contributes to simplifying and enhancing effective Facebook commercial measurement, establishing a reliable Facebook Ads report system.

Dashboarding ads can display all important indicators on one screen, helping users to have a general view
In the fierce competitive context of the current Dlection Market, the failure to use the Looker Studio or similar automated tools can be considered a strategic error. Most of the competitors and top marketers have applied these solutions to optimize the work process and make decisions. If not caught up with this trend immediately, marketing rooms may quickly be down, losing competitive advantage due to delays in data analysis and reaction to the market.
Three. Definition Dimension and Metric
To be able to build charts automatic Facebook report Effective on Looker Studio, understanding the following two fundamental concepts is necessary:
- Dimension New Century: As attributes, features, or criteria classification data used for analysis. Examples include: Dates, Operation Names, Advertising Group, Country, Age, Gender, Devices or Advertising Names Name. Dimensions provide context for data, helping answer questions about who? Where?
- Metric Index: As the quantitative values, representing the data used to measure the performance Facebook ads. The examples include: the cost of Amount Spent, the display of Impressions, the click clicks, Conversions, the cost on each CPA/CPL results, and ROAS Return on Ad Spend. Metrics provides information on how much?

The flexible and logical combination between the Dimensions and Metrics is a key factor in creating deep-range charts and report boards, which serve in useful ways for professionally measuring Facebook ads.
Four. Dimension and Metric Compatibility Compatibles
The selection and merging of Dimensions and Metrics fit as the quality determining factor of the Facebook Ads report automatically. Below are some typical ways of combining data to create important charts in the process of Facebook advertising:
Chart: Daily Advertising Results
- Dimension:
Date,Campaign Name,Ad Set Name,Ad Name. - Metrics:
Amount Spent,Link Clicks,Impressions,Conversions,CPA,ROAS,CTR. - Meaning: The table provides a detailed view of the performance of each campaign, advertising or advertising group on a daily basis. This is an integral component of any automated Facebook Ads report, which supports quick detection of performance and immediate adjustments.


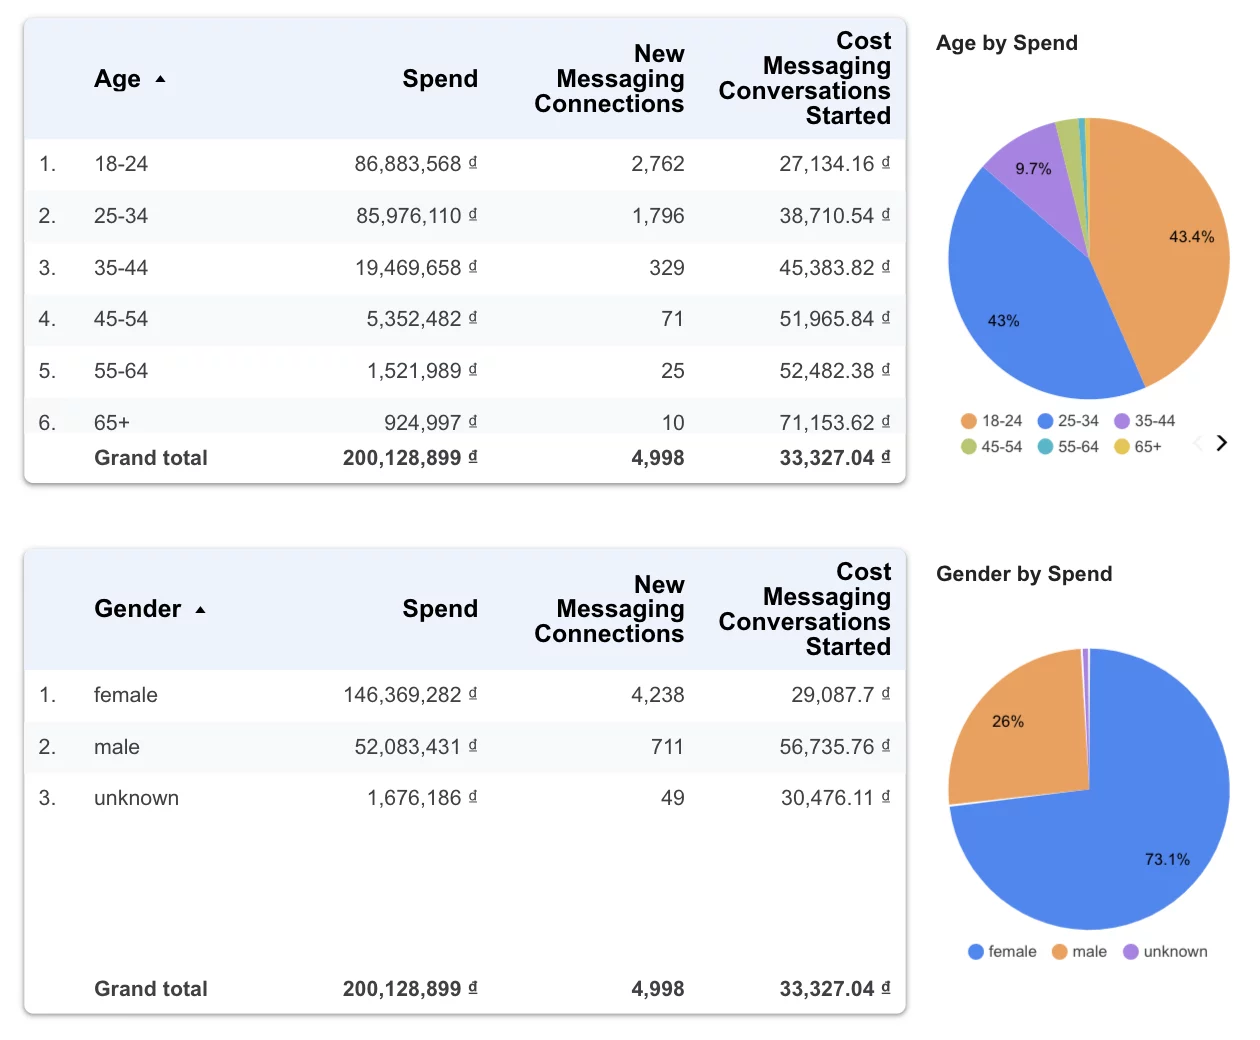
Circle Chart: Advertising Advertising by age, gender
- Dimension:
AgeAge,GenderGender. - Metrics:
Amount Spent,Conversions,ROAS. - Meaning: Round charts help intuitiveize the cost distribution rate or the resulting transition by age group or gender. Through which, users can better identify the most efficient customer portrait, contributing to optimizing the Facebook advertising process for each target object.
Line graphs: Costal orientation, results, costs per date
- Dimension:
DateDate. - Metrics:
Amount Spent,Total Conversions,CPAeitherCPL),Impressions. - Meaning: The line chart is a useful tool to track advertising performance trends over time. This allows for quick identification of increased/proximate points on costs, results or costs on each result, from which form provides the basis for making timely adjustments. This is an important factor in the constant measure of Facebook ads.

Geological Chart: Geological Advertising
- Dimension:
Country,Region,CityCountry, Area, City. - Metrics:
Amount Spent,Conversions,ROAS,CPA. - Meaning: Geological Chart for example: via Google Map integration in Looker Studio offers visualisation of advertising performance on the map. This helps clearly identify areas that are highly effective examples: high-profile ROAS, low CPA or less efficient areas, facilitating geographical goals for the Facebook Ads campaign.

Pivot Tagble: Content ratings in each advertising campaign
- Row Dimensions:
Campaign Name,Ad Name,Ad Creative Preview. - Column Metrics:
Impressions,Link Clicks,CTR,Conversions,CPA. - Meaning: Pivot table allows performance analysis of each of the templates of the content in the context of each ad group or campaign. Users can easily compare indexes such as CRT, CPA of different content samples to determine the most effective form of advertisements, thus improving the quality of advertising and raising the performance of Facebook advertising.

Five. Conclusion
The construction of a Facebook Ads report system automatically on Looker Studio, through the combination of Dimension and Metrics correctly, is a strategic step forward for any marketing room. The system not only deals with the problem of fragmented data but also provides a general, timely, and profound view of advertising performance. Since then, the process of measuring Facebook ads becomes more intuitive, facilitates quick decision making, optimizing budgets and achieving business goals that have been set.
Do not let the potential of data be missed. Take advantage of the Looker Studio to convert the data into valuable insights, contributing to the success of all your Facebook Ads campaigns!

