

Thông Tin Chung
Khóa học Looker Studio Siêu Tốc [NEW 2025] Data Visualization NoCode: Biến những con số phức tạp thành báo cáo trực quan quyết định thông minh chỉ sau vài giờ học. Dành riêng cho Marketer, Quản lý, Chủ Doanh nghiệp làm được ngay mà không cần biết code!
- Học phí: 150.000 VNĐ/buổi thời lượng tối thiểu 45 phút.
- Thời lượng mỗi buổi: Tối thiểu 45 phút, có thể kéo dài tùy nội dung thực hành.
- Hình thức học: Trực tuyến hoặc trực tiếp tùy yêu cầu.
- Mục tiêu: Trang bị kỹ năng sử dụng Looker Studio để xây dựng dashboard từ cơ bản đến nâng cao, phục vụ phân tích dữ liệu kinh doanh đa kênh.
- Yêu cầu: Máy tính có kết nối internet, tài khoản Google, trình duyệt Chrome khuyến nghị.
Thông tin Học phí: https://opendb.vn/khoahocdatavisualizevoilookerstudiocobandennangcao/#dangky
Thông tin Lịch học: https://opendb.vn/khoahocdatavisualizevoilookerstudiocobandennangcao/#lichhoc
📁 Nội Dung Khóa Học
⁂ Level 1: Nền Tảng Vững Chắc 2 buổi 300.000 VNĐ
Buổi 1: Tổng Quan Looker Studio, Tư Duy Thiết Kế Dashboard Hiệu Quả
Thời lượng: 4560 phút.
Mục tiêu: Hiểu tổng quan về Looker Studio, làm quen giao diện, và nắm tư duy thiết kế dashboard hiệu quả.
Nội dung chi tiết:
Introduction Looker Studio: Google's free tool, role in data analysis, integrated with Google ecosystem.
Discovery of Interface: Data Sources, Charts, Filters, Layout Theme.
Think 5W1H: Who Objects, What Data, When Time, Where Sources, Why Purpose, How Present.
Design Principle: Simplification, Color Contrast, Logical layout, Interactive.
Demo: Google Sheets Connection, generating Column Chart, Pie Chart, Scorecard, extra Xbox Range Control.
Practice: Self-created dashboard template with business simulation data, sales numbers.
Results: Computing Design Interface and Thoughts, completing basic dashboard.
Session 2: Dashboard Battle Service Report Shopee Singles from Google Sheets
Thời lượng: 4560 phút.
Goals: Build practical dashboard from Shopee Single Data.
Nội dung chi tiết:
Data Preparation: Google Sheets Date Strategy, Singles, Collections, Status.
Connect Google Sheets with Looker Studio.
Create Charts: Line Chart in Fall Over Time, Column Chart Number of Singles by Index, Table Details Singles.
Add Filter Controls: Filter by date, single status.
Customize the interface: Colors, layouts, adding the dashboard title.
Practice: Building the dashboard Shopee with sample data, save and share.
Results: Performing the basic dashboard Shopee, applied to actual data.
INTERVIEW 2: Dashboard Specialist Channel 6 p. 90,000 NWN
1st: Study With Lovel 1
Duration: 4560 minutes/NW.
Target: Try to gain background knowledge from Lvel 1, make sure the student is willing to pursue advanced education.
3: Data Connector Tool Builds Dashboard Google Ads Basic
Thời lượng: 4560 phút.
Target: Connect Google Ads data and build the dashboard performance analysis ads.
Nội dung chi tiết:
About Data Connector: Connecting Looker Studio with Google Ads.
Google Ads data structure: Impressions, Clicks, CTR, CPC, Conversions.
Create dashboard: Line Chart Clicks Over Time, Talle Operation Effect, Pie Chart Budget.
Add Operations Date Range Control and Filter Control.
Customize the interface: Theme, layout.
Practice: The dashboard building Google Ads with template data.
Results: Completed dashboard Google Ads Basics.
Season 4: Data Connector Tool Builds Dashboard TikTok Ads Basic
Thời lượng: 4560 phút.
Goals: Connecting TikTok Ads data and building dashboard visually.
Nội dung chi tiết:
Connect TikTok Ads with Looker Studio using Data Connector as Supermetrics.
Data Structure: Impressions, Reach, Engagement, Cost.
Creates dashboard: Column Chart Engagement in content, Table Advertising Performance, Line Chart Chi by Date.
Customize: Add Theme, adjust the chart size.
Practice: Building the dashboard TikTok Ads with template data.
Results: Completed dashboard TikTok Ads basic.
Session 5: Raised With Facebook Ads: Key Data Data Distribution
Thời lượng: 4560 phút.
Goals: Building dashboard Facebook Ads Advanced with deep indexes.
Nội dung chi tiết:
Connect Facebook Ads with Looker Studio via Data Connector.
Data structure: Reach, Impressions, ROAS, Conversion Rate.
Create dashboard: Scorecard ROAS, Conversion Rate, Combo Chart Reach and Impressions, Table Ad Set Performance.
Use Calculated Fields: Create ROAS Revenue/Cost, Conversion Rate.
Customize: Add Continental Formatting, optimum layout.
Thực hành: Xây dựng dashboard Facebook Ads với chỉ số tùy chỉnh.
Kết quả: Hoàn thành dashboard Facebook Ads nâng cao.
Buổi 6: Tuyệt Chiêu Blend Data: Xây Dựng Dashboard Marketing Sales Tổng Hợp Đa Kênh
Thời lượng: 4560 phút.
Mục tiêu: Kết hợp dữ liệu đa kênh để tạo dashboard tổng hợp.
Nội dung chi tiết:
Giới thiệu Blend Data: Kết hợp Google Ads, TikTok Ads, Facebook Ads, và Google Sheets Sales.
Thiết lập Blend Data: Key Join VD: Ngày, Chiến dịch, Metrics Doanh thu, Chi phí.
Tạo dashboard: Scorecard Tổng doanh thu, Tổng chi phí, Line Chart Doanh thu vs Chi phí, Table Hiệu suất kênh.
Mẹo tối ưu: Sử dụng Community Visualizations, Filter Controls nâng cao.
Thực hành: Xây dựng dashboard Marketing Sales đa kênh với dữ liệu mẫu.
Kết quả: Hoàn thành dashboard tổng hợp, hỗ trợ ra quyết định kinh doanh.
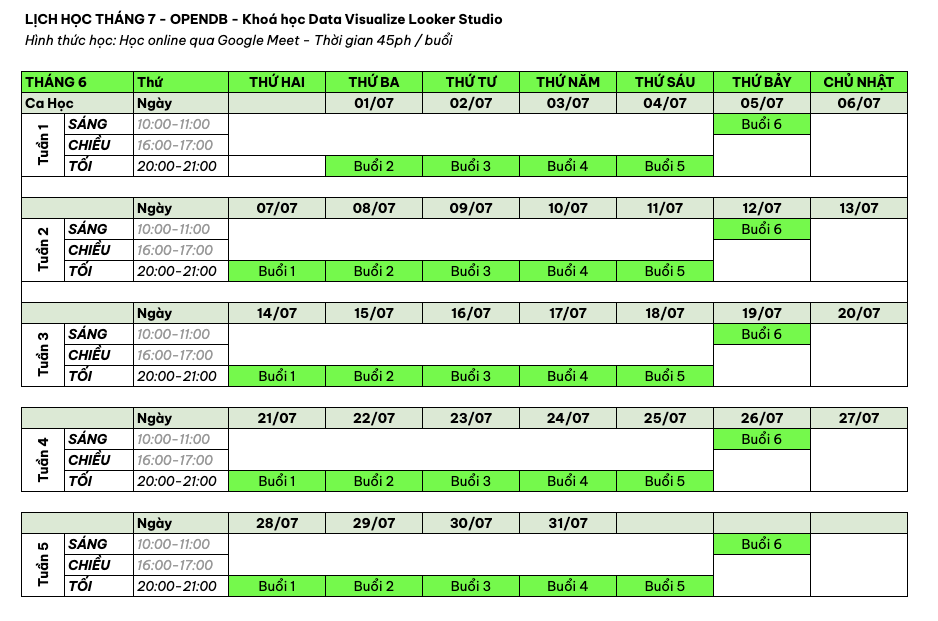
Lịch học
Tháng 7 / 2025
Lợi Ích Khóa Học
Thực chiến 100%: Tập trung vào thực hành trên dữ liệu thực tế.
Hỗ trợ sau khóa: Tài liệu, video ghi hình, giải đáp thắc mắc.
Ứng dụng ngay: Tự xây dashboard cho công việc hoặc báo cáo nội bộ.
Tài Liệu Hỗ Trợ
+ File Google Sheets mẫu dữ liệu giả lập và thực tế.
+ Video ghi hình từng buổi gửi qua Google Drive.
+ Hướng dẫn PDF: Cẩm Nang Looker Studio bao gồm Data Connector, Blend Data.

