loader image

Tuturges: Create a New Google Analytics Report with Looker Studio

by | Oct 9, 2024 | Khác | 0 comments

Create a new blank report

What's the Google Analytics report?

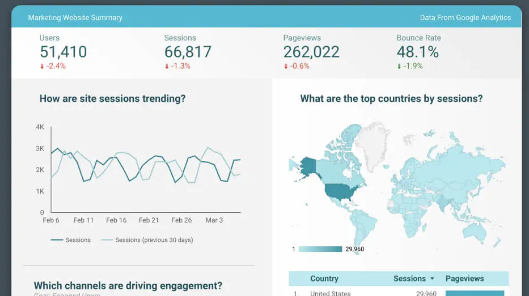
The Google Analytics Report displays, incorporates and visualises the main analysis data in a single panel to make the relevant parties easier to understand and make decisions. Using data from Google Analytics a website analysis tool to measure and track the traffic to your website, analysis reports help you understand how many people are accessing your website, where they spend most of their time and how quickly they leave your website.

explore trends and standard review KPI

Why do you need analysis reports?

You might ask: What does it mean to build the information board if the data is already available in Google Analytics?

Good question.

And you're right to say that the data you're adding to your analysis report is probably technically available in Google Analytics. But finding the right data, combining that data with other relevant data and defining trends is not always easy or clear. In addition, if you work with a group, other related parties may not understand how to read and understand data from inside Google Analytics accurately.

As soon as you click on my own data, you will see a new screen asking you to grant Google Analytics access to Looker Studio.

Ways you can customize Looker Studio's analysis report:

  • Change layout or design by moving the chart from one location to another
  • Delete data unrelated to your use
  • Add new chart by clicking Add Chart
  • Add another data page by clicking Add Page
  • Connect more analysis tools by clicking Add Data to display or combining data from multiple data sources examples: Google Search Carvette, Google Ads, Google Page
  • Edit the current chart and report to change the display data and how the data appears
  • Sets the date range for each chart to create static view mode or standard point

Guide

Guide: Create API Token Facebook

Update date: 01/01/2026 UI API token What is AIM API is a tool developed by META for programmers who are easy to run data tests through call API command connections. Instead of using third-party tools, programmers or...

Twinkle, Business

What is Data Conctors? Automated multisource data for business

Trong thời đại doanh nghiệp hoạt động trên hàng chục nền tảng khác nhau — từ quảng cáo, CRM, website cho đến bán hàng — dữ liệu trở nên phân tán và khó kiểm soát hơn bao giờ hết. Đây cũng là lúc Data Connector xuất hiện như “cầu nối” tự động giúp thu thập, chuẩn...

Guide

DB ConnectorMM Manual

DB Connector Section 1: Start Chapter 2: Configure Chapter 3: Get Data 4: Automation Chapter 5: Assistant AI Chapter 6: Support for DB Connector MD Manual The tool to connect and automate the Petrocelli report on Google...

Guide

Giáo Trình Khóa Học Looker Studio Thực Chiến

General Information Looker Studio Super Speed [NEW 2025] Data Visualization NoCode: Turn complex figures into smart decisions visual reports after only a few hours of study. It's for Marketer, Manager, Business Masters who can do it without...

Guide

Procted: Guide to replace FM report data ads bsic

If you don't have a looker Studio account please create new at: http://www.looystudio.google.com/ Use the main email and the browser is posting Facebook accounts so that the automated system is as fast and as accurate as you are. "The report's clone guide...

EnglishenEnglishEnglish